
In this entry, let’s study one of the angles for breaking down by addition: breaking down by numbers (quantitative variables).
This entry is part of a series on breaking down by addition. If you get lost along the way, read the series in order, starting from the entry below.
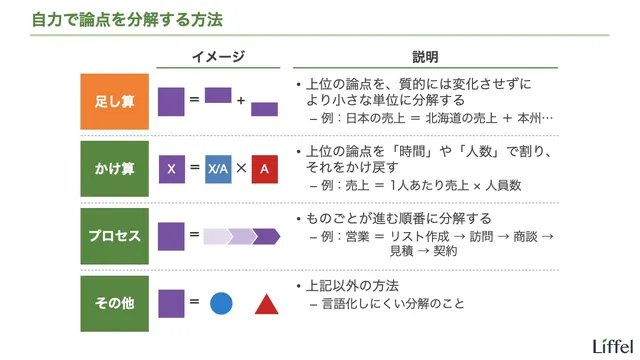

Let’s begin.
toc
- Angle 1 for Addition: Numbers
- A Caution About Numbers: Set the Classes
- How to Decide on Classes
- References
Angle 1 for Addition: Numbers
The first angle for breaking down by addition is numbers. That’s the upper part of the table. The technical term is quantitative variables. Keep that in the back of your mind too. Specifically, these are angles like the following:
- Time
- Age
- Money
- Income
- Price
- Other (sales, profit, costs, etc.)
- Weight
- Speed
All of these can be expressed in numbers. Breaking down by numbers means breaking down a question with these concepts.
Examples
Let’s look at some examples. Here, let’s break down the question “What kind of people are buying this product?” from two angles.
First, let’s break it down by age (age group). It looks like this:
- What kind of people are buying this product?
- People under 10?
- Note: if this age group doesn’t matter for the product, you can drop it
- People in their teens?
- People in their 20s?
- People in their 30s?
- People in their 40s?
- People in their 50s?
- People 60 and over?
- People under 10?
Confirm that the broken-down questions contain numbers.
Next, let’s break down the same question by income.
- What kind of people are buying this product?
- People with an annual income under $20,000? (x < 20)
- $20,000–$40,000? (20 ≤ x < 40)
- $40,000–$60,000? (40 ≤ x < 60)
- $60,000–$80,000? (60 ≤ x < 80)
- $80,000–$100,000? (80 ≤ x < 100)
- $100,000 or more? (100 ≤ x)
Likewise, the broken-down questions contain numbers. A breakdown like this is breaking down a question by numbers.
Exercise
Let’s check what you’ve learned with an exercise.
Break down the following questions using the angle specified in parentheses.
When does this product sell? (Time of day, such as “morning” and “afternoon”)
Try writing your answer in the box below.
- When does this product sell?
- Late night (midnight–6 a.m.)?
- Morning (6 a.m.–noon)?
- Afternoon (noon–6 p.m.)?
- Evening (6 p.m.–midnight)?
How fast do people drive on this highway? (Speed)
- How fast do people drive on this highway?
- Under 50 mph?
- 50–60 mph?
- 60–70 mph?
- 70 mph or more?
A Caution About Numbers: Set the Classes
When breaking down by numbers, you need to set appropriate classes yourself. A class is “an interval used when breaking down by numbers.”
Class: an interval used when breaking down by numbers
Let’s check with the earlier example.
- What kind of people are buying this product?
- People with an annual income under $20,000? (x < 20)
- $20,000–$40,000? (20 ≤ x < 40)
- $40,000–$60,000? (40 ≤ x < 60)
- $60,000–$80,000? (60 ≤ x < 80)
- $80,000–$100,000? (80 ≤ x < 100)
- $100,000 or more? (100 ≤ x)
As you can see, this example uses “every $20,000” as the class. In other words, it creates income brackets of $20,000 each.
When breaking down by numbers, you must decide on classes. The reason is simple: without classes, you can’t break things down.
To begin with, data at intervals of “one dollar” or “one year of age” often doesn’t exist, and even if it did, the information wouldn’t fit into an easy-to-understand form. Since breaking down isn’t the goal but a means of answering the higher-level question, you need to group the data so that the answer is easy to reach.
Units of Time (Classes)
Note that when you use “time” as the angle, fine-grained classes are already provided as dedicated units. That shows how deeply time is rooted in our lives.
Although this is a detail, when using time as the angle, distinguish between points in time (when) and elapsed time (how much time has passed since a certain point). Both work as angles, but avoid mixing them up. In business, points in time are used more often.
Typical units of time are summarized below. Choose a unit of appropriate size for the situation.
First, units for points in time:
- Time of day
- 7 a.m., 8 a.m., 9 a.m.…
- Morning, afternoon, evening
- Handy when you want a rough breakdown
- However, make the definitions clear, as in “morning (7 a.m.–noon)”
- Month (January, February, March…)
- Quarter (every three months)
- Often used in business
- Year
- Multi-year periods
- Example: 2001–2005, 2006–2010, 2011–2015, 2016–2020 (five-year periods)
- Every few years
- Example: 2000, 2005, 2010, 2015, 2020 (every five years)
- Use only when you can’t get data for each year or want to see rough trends over a very long period (such as 50 years)
- As a rule, you shouldn’t hide data
Next, units for elapsed time:
- Seconds
- Minutes (60 seconds)
- Hours (60 minutes)
- Days (24 hours)
- Weeks (7 days)
- Months
- However, using “months” for elapsed time makes the number of days ambiguous, so it’s safer to use something like “30 days”
- Years (365 days)
Use finer or longer units as needed.
Exercise
When breaking down the following questions by time, think about which unit of time is appropriate.
You’re studying full-time to retake university entrance exams. When should you study?
In this case, probably “time of day.” Once you’ve secured enough time in the day for sleep, meals, breaks, exercise, and so on, you should spend all the rest studying. Since you’re studying full-time for a retake, there’s no point in separating weekdays and weekends either (drill-sergeant mode).
How will Japan’s population change from now on?
In this case, “every five years” is probably best. Although it’s a matter of feel, since it’s 2019 now (at the time of writing), you’d want to look at data up to around 2050. Yearly data would be too much. Also, in this case, you only want to know the rough trend and aren’t interested in year-to-year fluctuations.
How to Decide on Classes
So how should you decide on classes? Here’s the earlier example again.
- What kind of people are buying this product?
- People with an annual income under $20,000? (x < 20)
- $20,000–$40,000? (20 ≤ x < 40)
- $40,000–$60,000? (40 ≤ x < 60)
- $60,000–$80,000? (60 ≤ x < 80)
- $80,000–$100,000? (80 ≤ x < 100)
- $100,000 or more? (100 ≤ x)
There are three key points:
- Make them exhaustive (MECE)
- Class width: divide classes at equal intervals as far as possible
- Number of classes: keep the number of classes manageable
Let me explain each in turn.
Point 1: Make the Classes Exhaustive (MECE)
First, set the classes so they’re exhaustive (MECE). There’s no reason to create gaps on purpose. In the example above too, everyone from people with zero income to people with infinite income is covered.
Since it’s hard to express in words (natural language) that there are no overlaps (that the classes are disjoint), I recommend keeping formulas in mind when breaking things down1.
Note that after breaking things down exhaustively, it’s fine to exclude clearly unimportant classes from analysis.
Point 2: Class Width
Next, unless there’s a reason, make the classes equal in width. If the width changes conveniently, you can’t compare the classes.
Let’s check with the example.
- What kind of people are buying this product?
- People with an annual income under $20,000? (x < 20)
- $20,000–$40,000? (20 ≤ x < 40)
- $40,000–$60,000? (40 ≤ x < 60)
- $60,000–$80,000? (60 ≤ x < 80)
- $80,000–$100,000? (80 ≤ x < 100)
- $100,000 or more? (100 ≤ x)
In this example, everything except the top class is at equal intervals of $20,000. Since numbers have the property of “having no upper limit,” the top class has to be treated as “XX or more.”
However, this rule isn’t so absolute that the classes must be equal no matter what. For income, you often see breakdowns like this:
- What kind of people are buying this product?
- People with an annual income under $20,000? (x < 20)
- $20,000–$40,000? (20 ≤ x < 40)
- $40,000–$60,000? (40 ≤ x < 60)
- $60,000–$80,000? (60 ≤ x < 80)
- $80,000–$100,000? (80 ≤ x < 100)
- $100,000–$150,000? (100 ≤ x < 150)
- $150,000–$200,000? (150 ≤ x < 200)
- $200,000 or more? (200 ≤ x)
In this case, the interval for the two classes in bold is “$50,000,” not the “$20,000” used up to that point. The reason is that grouping people in this income range in $20,000 brackets would make each bracket too sparse.
Although the class width changes partway, if you want to analyze the $100,000–$200,000 range properly, this breakdown is better than lumping it all into a single “$100,000 or more” class.
In this way, decide the class width by balancing the purpose of the analysis against how frequently the data appears.
Point 3: Number of Classes
Finally, there’s no clear answer for the number of classes. “What’s the optimal number of classes?” seems to be a question that many researchers have examined without settling (reference).
What can definitely be said, though, is that too many classes make things hard to follow. Finer isn’t better.
So at what point does it become hard to follow? Personally, I think eight or nine is about the limit. If you go beyond that, consider widening the classes to reduce their number.
Handling the Top Class
When deciding the width and number of classes, the rule is to make sure the top class doesn’t carry much weight. Since it extends upward to infinity, you don’t want the conclusion to be “that class is important.”
As a rule of thumb, it’s good if the frequency of data in the top class is 10% or less. Then it won’t look important. Conversely, once it exceeds 10%, it seems better to make the classes a bit finer.
So although it’s hard to say anything definitive about class width and number, adjust them skillfully while looking at the purpose of the analysis and how frequently the data appears.
That covers breaking down by addition using numbers. Next time, let’s learn breaking down by categories (qualitative variables).

Entries related to critical thinking are collected on the page below. Feel free to use them as a reference.

References
Footnotes
-
Of course, if you use words like “under” and “or more” rigorously, you can express that there are no overlaps in words too. ↩