This entry explains how to make a comparison table.
In life, you often have to choose one of several options. Shopping for electronics is one example. You have to pick one product from the candidates.
To make the right decision in such situations, a comparison table helps. Let’s learn what a comparison table is, how to lay out the options, and from what angles to evaluate them. Since it’s a thinking tool you can use in any situation, make sure you understand it well.
Let’s begin.
toc
- What Is a Comparison Table?
- Example: Choosing a School Club
- Topics for Comparison Tables
- If You Want to Keep Learning
What Is a Comparison Table?
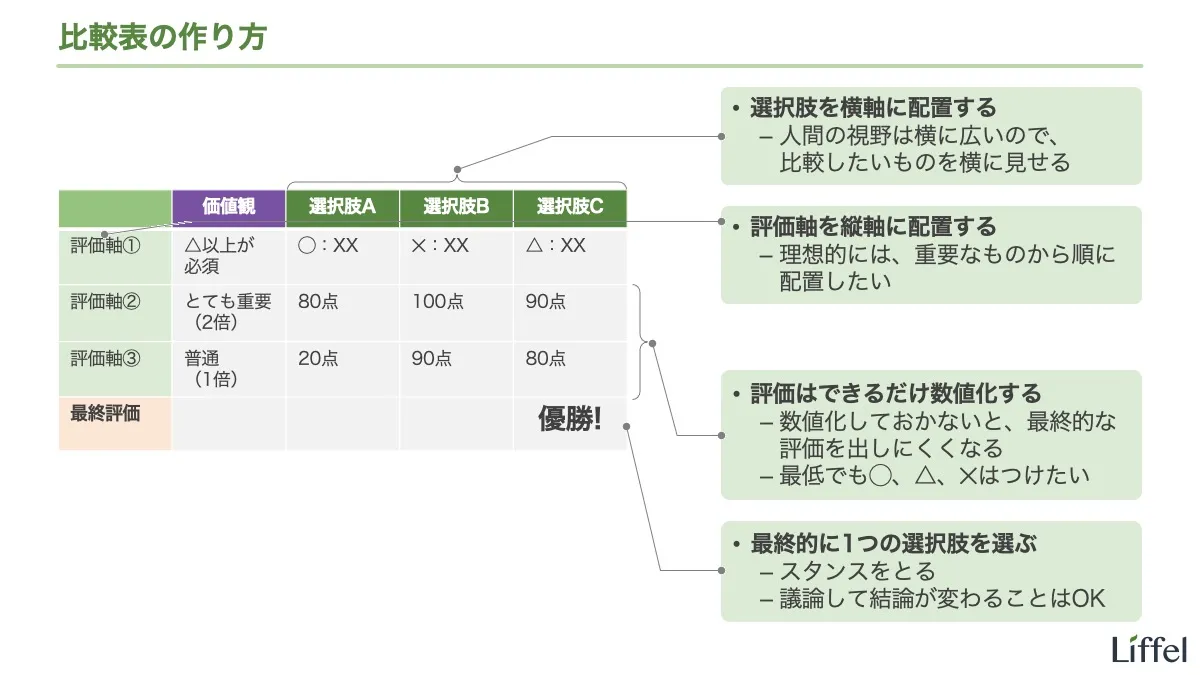
Let’s get right to it. Take a look at the slide below, which summarizes what a comparison table is.
As shown, a comparison table is a table with the options along the horizontal axis (with values in the first column only) and the evaluation criteria along the vertical axis. For example, a comparison table for phones looks like this:
| X Phone | Y Phone | |
|---|---|---|
| Display | 5 inches | 6.2 inches |
| Battery | 18 hours | 24 hours |
| Price | $400 | $600 |
You’ve probably seen something like this before. Since I’ll explain “values” later, I’ve left them out here.
What Is This Table Thinking About?
Although it may not click yet, don’t worry. Actual examples come later. Before that, let’s make clear what this table thinks about, and in what order. This is the key point. Take a look at the slide below.
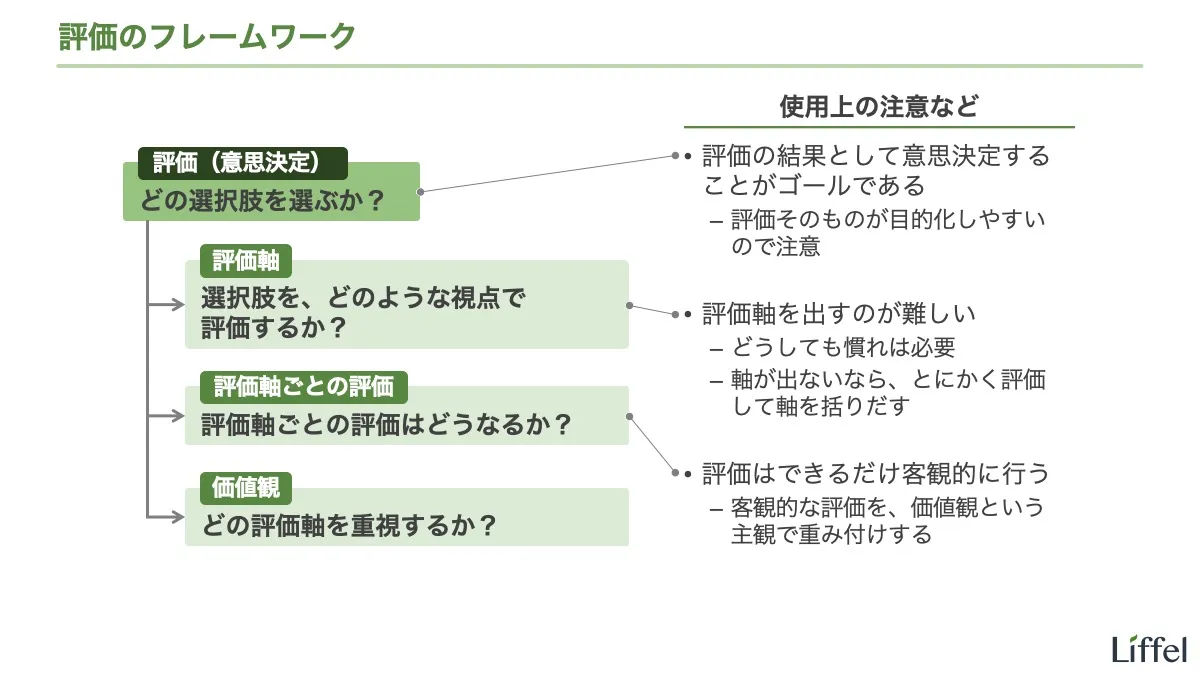
As shown, a comparison table is a framework (a structure for thinking) for evaluating options. We make this table to choose one of the options. Don’t forget this.
Evaluating options = Evaluation criteria × Evaluation by criterion × Values
Written as a question structure, it looks like this:
- Evaluating options: Which option is best (= should be chosen)?
- Evaluation criteria: From what angles will we evaluate each option?
- Evaluation by criterion: How does each option evaluate on each criterion?
- Values: How will we weight each criterion?
In practice, you start by listing the options. And the reason you list options is ultimately that you want to decide what to do.
Putting it all together, the question structure looks like this:
- What will we do as a solution?
- Listing solutions: What options are there as solutions?
- Evaluating options (narrowing down): Which option is best? (= Which option will we carry out?)
- Evaluation criteria: From what angles will we evaluate each option?
- Evaluation by criterion: How does each option evaluate on each criterion?
- Values: How will we weight each criterion?
Since explaining all of this would take too long, I’ll skip it. If it doesn’t click, read the entries in order starting from the one below.
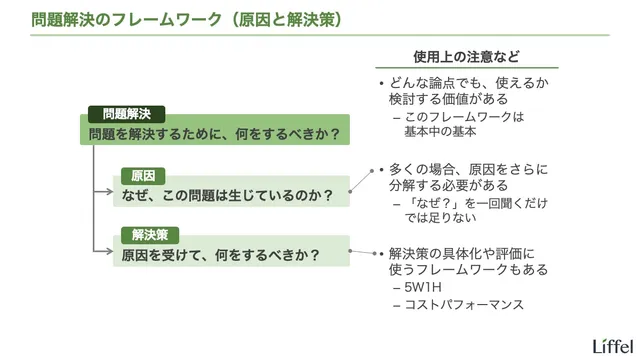

In other words, a comparison table puts the question structure above into a table. Put another way, the question structure comes first, and the comparison table is merely its output.
Unless you understand this well, it’s common to end up treating making the table as the goal and losing sight of what you wanted to think about. The purpose of making a comparison table is to “decide what to do,” and the table is only an intermediate deliverable. Keep this in mind.
The purpose of making a comparison table is to evaluate options and make a decision
Example: Choosing a School Club
From here, let’s look at an example of making a comparison table. I’ll use choosing a school club, something almost everyone has experienced.
You enrolled at Eurasia High School today. At Eurasia High School, all first-year students are required to join a club. Use the evaluation framework to decide which club to join.
First, write the question structure. Just apply the framework above as is.
- Which club should I join?
- Listing solutions: What clubs does Eurasia High School have?
- Evaluating options (narrowing down): Which club is best for me?
- Evaluation criteria: From what angles will I evaluate each club?
- Evaluation by criterion: How does each club evaluate on each criterion?
- Values: How will I weight each criterion?
Let’s turn this question structure into a comparison table.
From here on, if possible, open a spreadsheet app such as Excel and make the table yourself (pen and paper work too). There’s no better way to learn than doing it yourself.
STEP 1: Make a Mockup of the Comparison Table You Ultimately Want
First, create what you want to see at the end. This is the key point.
Following the framework, you can create the structure of the comparison table at the start. So let’s go ahead and make it. Before reading on, imagine for yourself what the final table will look like.
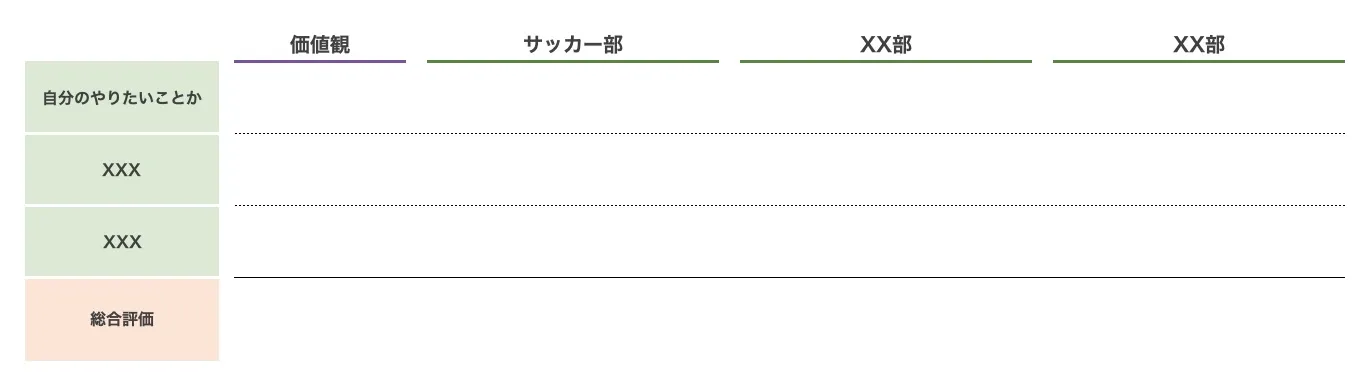
At this stage, it’s enough to know that “the clubs go along the horizontal axis and the evaluation criteria along the vertical axis,” but to make that clear, I recommend filling in some specifics. I’ll explain the “overall evaluation” row at the bottom later.
“Creating a mockup of what you want to see at the end, at the start” is very important, not just for comparison tables. Without a goal, your work misses the mark. In this case too, if you want to ask people questions to gather information, you won’t even know what to ask without a picture of the final deliverable.
Of course, if you realize partway through that “this mockup won’t work,” it’s fine to redo it. In any case, when doing each task, keep in mind “what I’m ultimately making by doing this.”
Create what you want to see at the end, at the start
STEP 2: Fill In the Horizontal Axis (Options)
Once you have the structure, all that’s left is to do the work and fill in the table. First, fill in the horizontal axis. In other words, list your options. What clubs does Eurasia High School have?
In this case, you don’t need to think about this question, since schools normally hand out a list of clubs. So let’s say Eurasia High School has the following clubs. For clarity, I’ve kept the number small.
- Soccer club
- Basketball club
- Art club
These are your options. Let’s put them into the table. Here, I’ve also added categories for sports and arts.
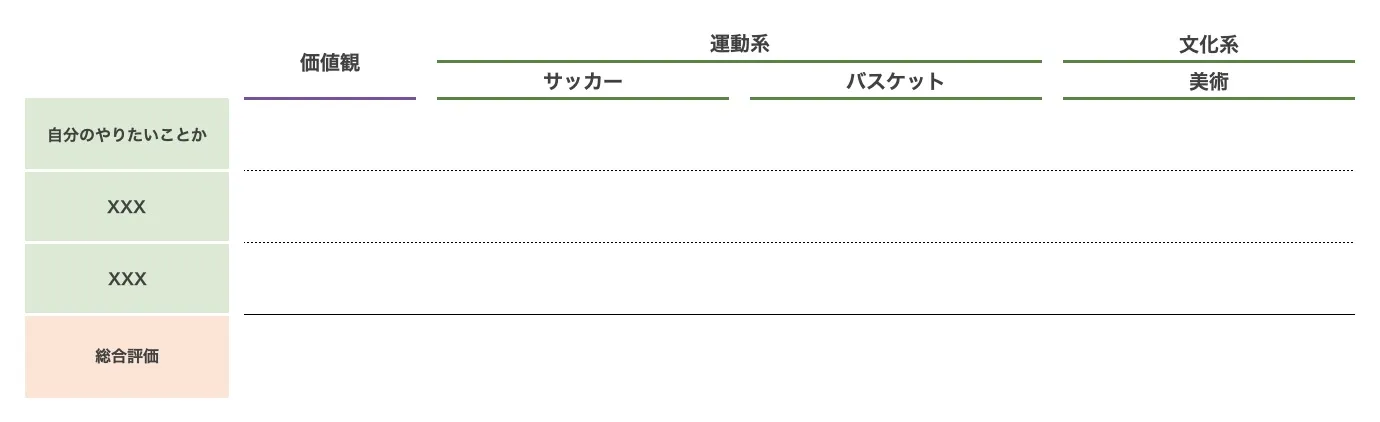
Note that cases like this example, where you’re handed an exhaustive set of options from the start, are the exception.
In practice, what options you can come up with depends on your creativity and research skills. Since you can’t choose options you miss here, take your time.
In this case, “starting a new club yourself” would be a creative option (depending on school rules). It would complicate things, so I won’t go that far here, but keeping in mind the perspective of “exploring possibilities beyond the options you’re given” broadens your range of options.
STEP 3: Fill In the Vertical Axis (Evaluation Criteria)
Next, decide on the evaluation criteria. What points (angles) are there for choosing a club?
Some that come to mind easily are:
- Whether it’s something I want to do
- Time commitment
- The reputation of the faculty advisor
What other points are there? Before reading on, think about it yourself. It helps to recall what criteria you and those around you used to choose clubs in the past. Searching for keywords like “how to choose a club” also works.
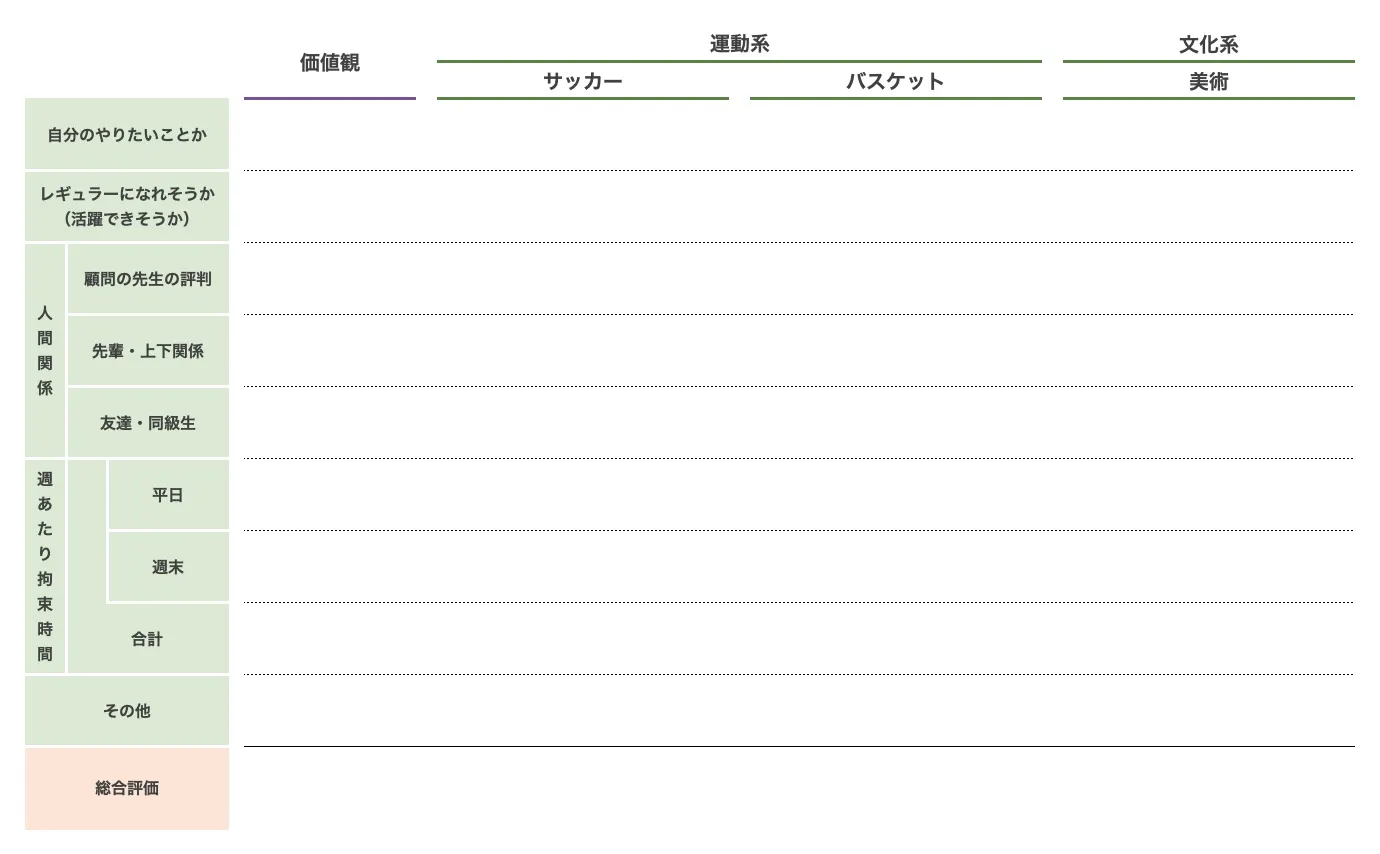
Other possible criteria include the following. Since too many criteria make the table hard to follow, I’ve left them out this time.
- Cost (club fees, equipment)
- Social standing within the school
- Whether you’ll gain skills useful after graduation
- For time commitment, it’s more accurate to estimate the total for the year, including activities during summer and winter breaks
Also, adding “other” as a criterion lets you cover angles that don’t fit the existing criteria when they come up. I recommend including it just in case.
As with options, in practice, you should come up with as many evaluation criteria as possible.
As I’ll explain later, since unnecessary criteria get cut by weighting them according to your values, having many criteria at this stage isn’t a problem. What’s scary is missing an important criterion. In my view, in this example, the criterion “whether I’m likely to make the starting lineup (whether I can play an active role)” is important yet easily overlooked.
What to Do If You Can’t Come Up with Evaluation Criteria
However, you can’t always come up with criteria as neatly as in this case. At first, you probably won’t be able to come up with good criteria. There are two reasons.
First, until you get the knack, it’s hard to come up with criteria. There’s simply no way around this.
The fix is simple: start by writing only rough criteria such as “advantages / disadvantages” or “benefits / risks,” and move on to the next step (evaluating).
As you write the evaluations, certain words will come up again and again. Focus on them and pull out criteria from them. For example, if words like “expensive / cheap” keep appearing in your evaluations, what you’re concerned about is “cost.”
Conversely, if the vertical axis stays as vague as “advantages / disadvantages,” that proves you haven’t managed to pull out criteria. That’s embarrassing if you’re making a comparison table as a professional, so be sure to avoid it. There seems to be such a thing as a “pros and cons table,” but you shouldn’t make one (although it can’t be helped until you get used to it).
Second, in areas where you have no experience, you won’t know the evaluation criteria. For example, someone who has never programmed can’t possibly know the criteria for a comparison table of ways to learn programming. This time, it only seems easy to come up with criteria because the situation, choosing a club, is one most people have experienced.
When making a comparison table in an area where you have no experience, you look for criteria in ways like these:
- Try it all out yourself
- Search
- Ask experts (people with experience)
The method I recommend most is trying it all out yourself. It makes a world of difference in how convinced and convincing you are. However, time or cost sometimes makes this impossible, so in that case, use the other methods.
Arranging Options and Criteria
As an aside, I often see comparison tables with the axes reversed (options on the vertical axis and criteria on the horizontal axis), so let me add a note on this.
First, as a rule, you should put the options on the horizontal axis. Human vision is wide horizontally, and things lined up side by side can be compared at a glance. When you make a comparison table, what you want to compare is the options, not the criteria. So you should put the options on the horizontal axis.
The problem is smartphones. As you know, smartphones are tall. If you put the options on the horizontal axis on a tall display, the options (what you want to show) spill off the screen. So consider swapping the axes when both of the following conditions apply:
- The table is expected to be viewed on a smartphone
- There are many options (five or more, as a rough guide)
Still, you should consider swapping axes only as a last resort. Since putting options on the horizontal axis is definitely the standard way, putting them on the vertical axis looks amateurish. If possible, consider other measures, such as cutting options1.
STEP 4: Fill In the Table (Evaluate)
Back on track. Now that the criteria are set, actually evaluate. What happens when you evaluate each club against the criteria above?
Here, you evaluate as objectively as possible through research such as asking questions and observing. See also the entry below.
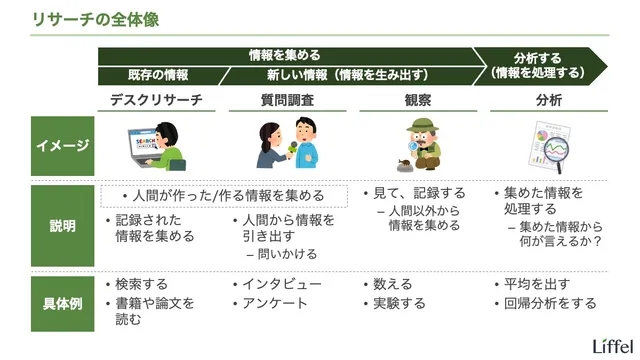
However, as in this case, it’s hard to evaluate everything objectively. Since evaluating isn’t the final goal, keep in mind that it’s also important to give up at some point and move on.
Now, suppose you’ve gathered information from friends and upperclassmen and finished evaluating. After filling in the table, you get the following:
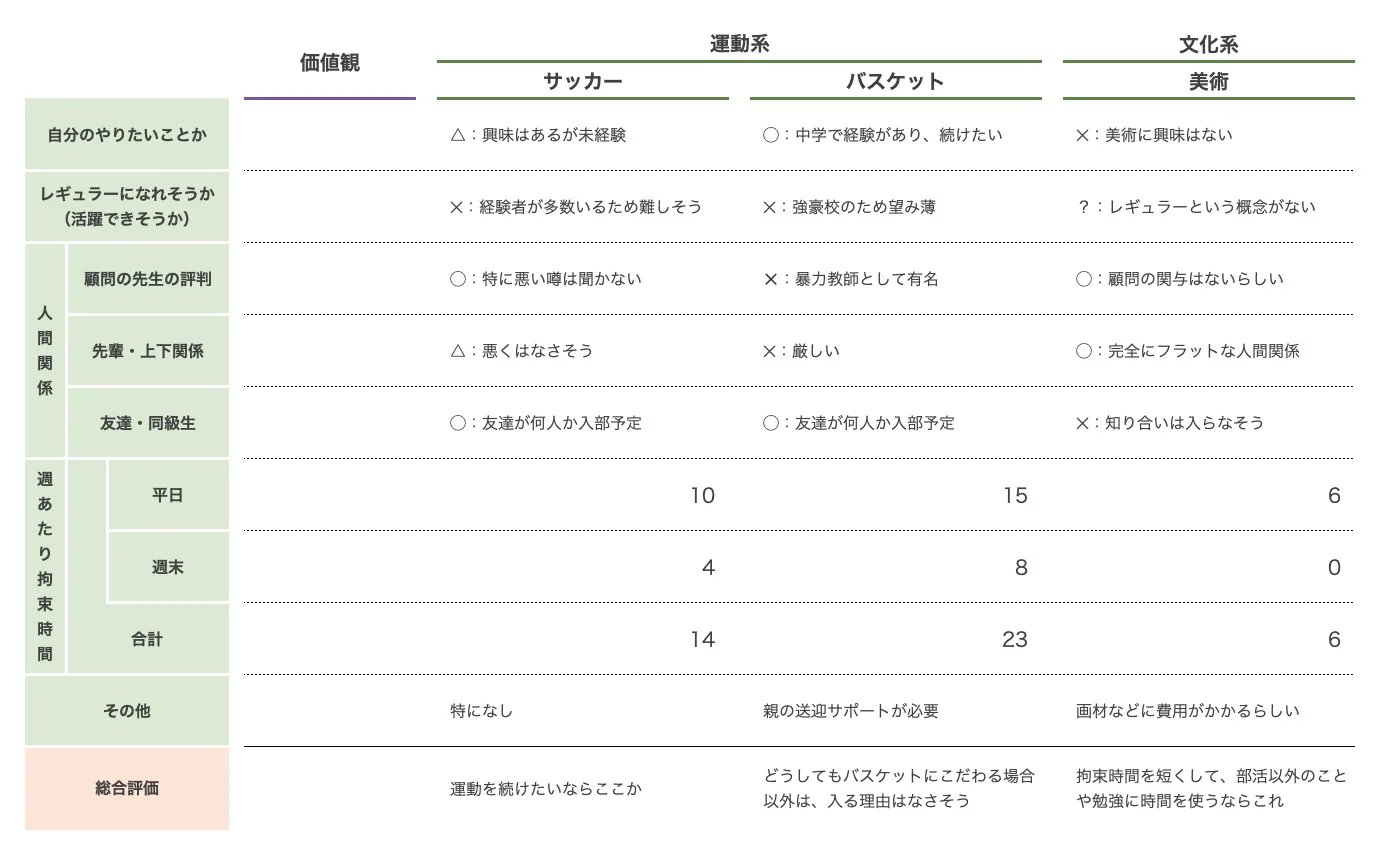
There are two key points here.
First, take a stance when evaluating. Specifically, write in either marks (such as ◯, △, and ✕) or numbers. These are the only two forms you can use for evaluation (adding ◎ to the marks, or using expressions like “good / bad,” is fine).
A common sight in comparison tables like this is “only text comments, with no clear evaluation.” That’s useless for decision-making, and if you’re making the table to show others, it gives the impression that you’ve dodged evaluating. Be sure to write in evaluations.
Of course, your evaluations may be wrong. But as long as you write the premises for each evaluation alongside it, there’s no problem. Then you can discuss them.
Next, once you’ve evaluated each criterion, evaluate the options themselves. In this case, that means thinking about the question “In short, who should choose the soccer club?” (and likewise for the basketball and art clubs). That’s what’s written in the “overall evaluation” row at the bottom.
To repeat, what we ultimately decide is “which option to choose.” The individual evaluations are just inputs for deciding that. It defeats the purpose to get absorbed in the individual evaluations and leave unclear “which option is recommended for whom.” Be careful not to fall into this trap.
STEP 5: Clarify Your Values (Weight the Criteria)
Finally, clarify your values. Of the criteria in the table, which do you prioritize?
Once you know this, the option to choose follows naturally. For example, if you prioritize doing what you really want to do in your club, you should choose the basketball club. If you want to work hard on your studies in high school and so want a club with the shortest time commitment, the art club. The bold parts are concrete examples of values.
For reference, here’s the finished table with the values column filled in.
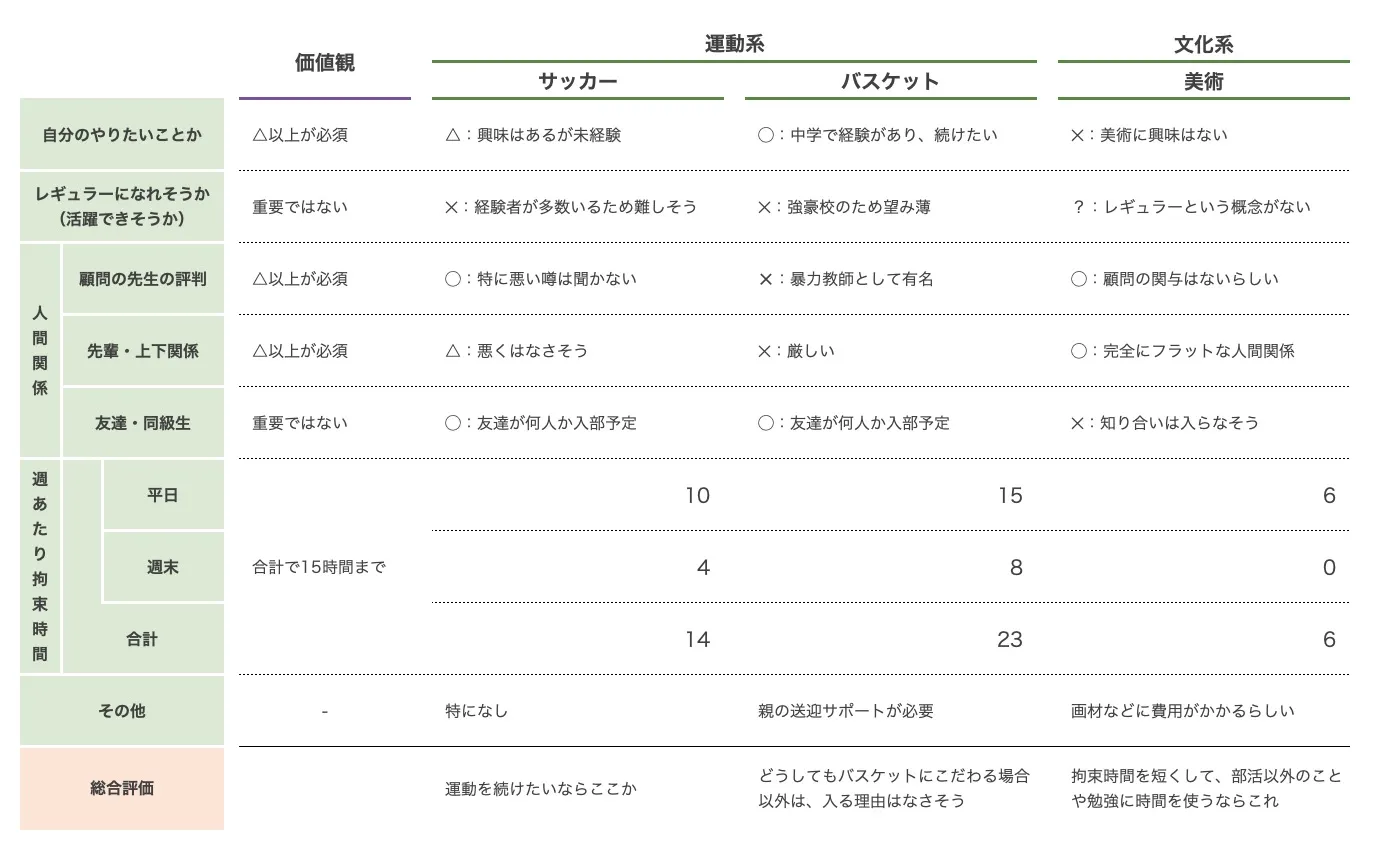
In this case, the conclusion is that you should join the soccer club. With that, the goal of making the comparison table (= making a decision) is achieved.
In reality, however, you’ll rarely be able to set values this detailed. Values tend to be rough, along the lines of “In short, this is what matters.” So in real decisions, the important criteria often narrow down to one, or at most two.
In fact, when you chose a club, you probably didn’t think this carefully. You probably decided based on just a few criteria, like “because I want to do this” or “I want a club with a short time commitment.”
Since values ultimately narrow down the important criteria like this, you can swap the order of STEPs 4 and 5, and if possible, you should. If you know your values first, you can reduce the total amount of work by evaluating only the important criteria.
But when making comparison tables like this at work, my experience is that you’re often “making the table for someone else, whom it’s hard to meet and whose values you don’t know,” so things rarely go as ideally as they should.
Also, from the perspective of those having the table made, revealing their values first risks having the evaluations distorted toward a convenient decision. If you’re the one having the table made, you should think carefully about whether to share your values, even if they’re clear to you.
When You Don’t Know Your Values
Now, think about this. People normally choose clubs better in high school than in middle school. Why is that?
The answer is simple: through their experience in middle school, they’ve formed values about choosing clubs. From real experience in middle school, they know the points for choosing a club (criteria) and what they should prioritize (values).
Conversely, since there’s no way to have formed values when choosing a club in middle school, it inevitably becomes something of a gamble. Some of you may have chosen a club “because a friend was joining” or “because the sport was popular” and regretted it.
In this way, in areas where you have no experience, your values aren’t settled, so you can’t decide or you make the wrong decision. What should you do?
As far as I know, there’s nothing you can do about this. If you don’t absolutely have to decide, you can put off the decision. But if you have to decide, you have no choice but to decide even without settled values.
A realistic countermeasure is to keep the option of changing your decision afterward.
In the club example, creating a rule like “students may switch clubs once a year” would count as this. Then even if you choose wrong, the damage is limited to one year. Whether this is realistic to introduce, though, I don’t know.
A more familiar example is getting a job. When you’ve never worked, it’s impossible to form values about work. Yet “not working” isn’t realistic for most people, and it wouldn’t move anything forward anyway. You have no choice but to start working somewhere.
Once you actually work, you form your own values, like “Pay really is everything” or “I don’t want to work this hard.” Based on that, you can decide again whether to keep working at your current job or look into changing jobs.
In other words, in the case of getting a job, “keeping yourself in a position where you could change jobs if you wanted to” is “the option of changing your decision.”
Topics for Comparison Tables
Finally, here are some topics that might be interesting for making comparison tables. Try them when you have time (there are no sample answers).
- Where to work
- Industry: Which industry should I work in?
- Company: Which company should I work for?
- How to learn programming: How should I learn programming?
- A hobby to start as an adult: What hobby should I take up now?
That covers how to make a comparison table. When making a decision, if you can make “the comparison table you want to see at the end” first, things often go smoothly from there. It may be hard until you get used to it, but since it’s a basic skill for decision-making, practice it again and again until it becomes second nature.
If You Want to Keep Learning
Thank you very much for reading this far. If you’d like to keep learning critical thinking, continue to the entry below. It explains cost, which always belongs on the vertical axis of a comparison table.

Entries related to critical thinking are collected on the page below. Feel free to use them as a reference.

Footnotes
-
Personally, when the main purpose is “showing the overall picture of many options” rather than “choosing one option,” I think putting the options on the vertical axis is easier to understand. ↩